“Because to take away a man’s freedom of choice, even his freedom to make the wrong choice, is to manipulate him as though he were a puppet and not a person.” ― Madeleine L’Engle (2008). “The Young Unicorns”, p.202, Macmillan
Americans who identify as Independent make up over 40% of registered voters. These types of voters are a hard bunch to study. What do independent voters want? By definition, they all hold unique belief systems that aren’t easy to fit in a box. However, our research at the Independent Center (download it here) suggests at least one common theme: On nearly every subject independent voters want to increase their choices. They want more choices in candidates and they want more choices in their solutions to policy problems.
The fact that independent voters want more choices in their candidates should be no surprise. If they liked what the two-party system presented to them, they wouldn’t be independent.
What does the data say about this?
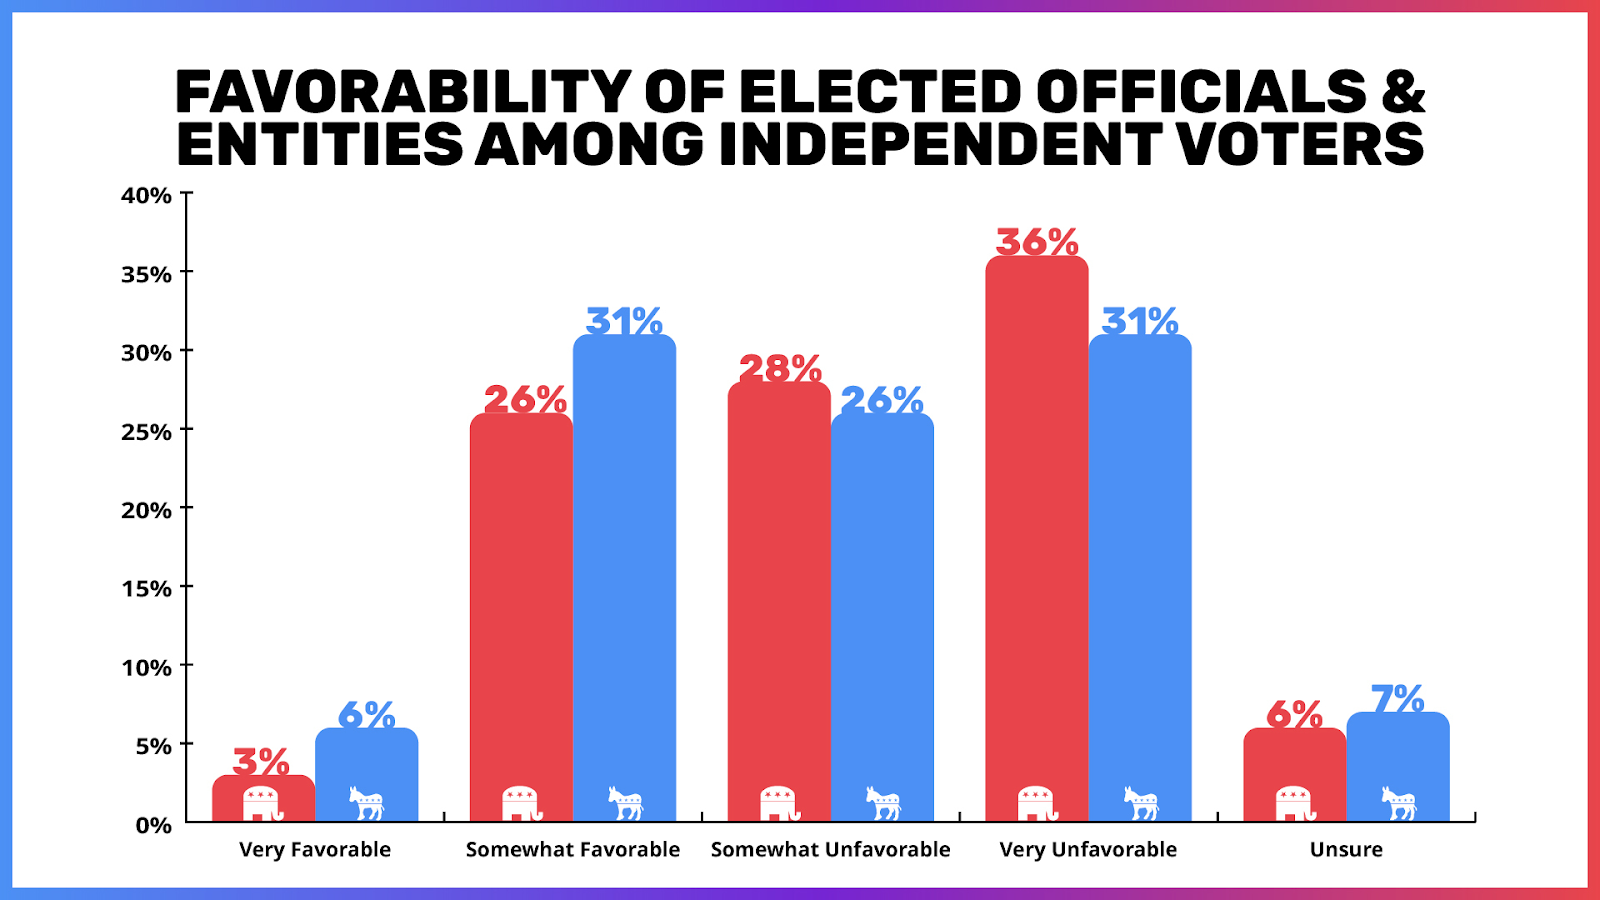
When rating their opinions of the two major political parties, independents overwhelmingly expressed dissatisfaction. Specifically, we gave them a randomized list of officials and entities in the US and asked them to “[…]please indicate whether you have a favorable or unfavorable opinion of each.”
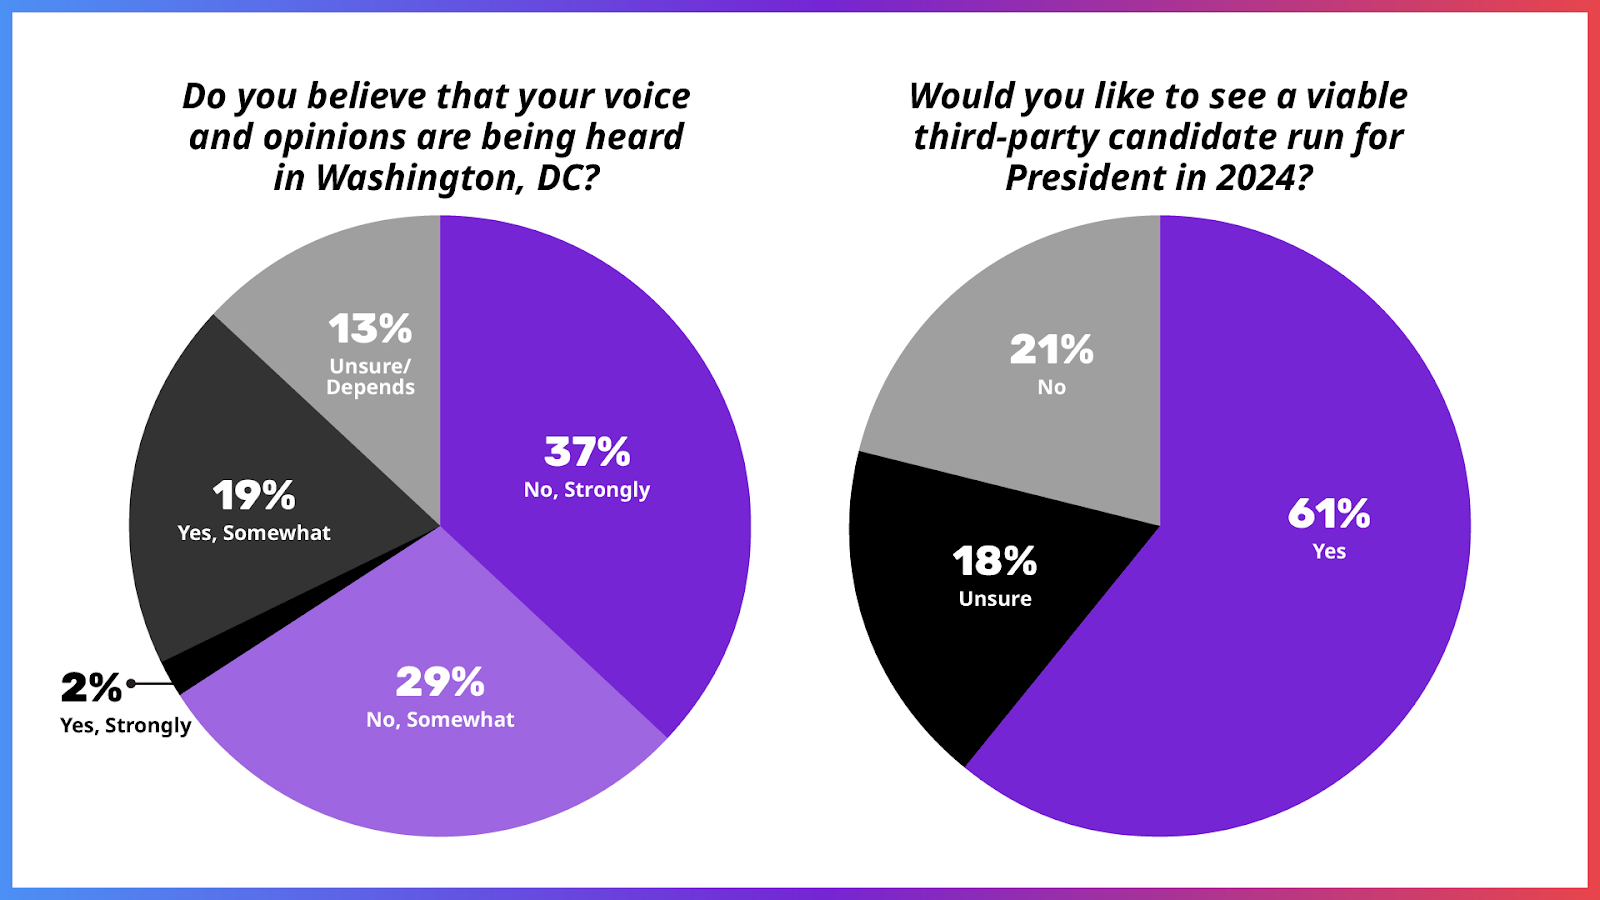
Perhaps this is why when asked “Do you believe that your voice and opinions are being heard in Washington, DC by your elected representatives?” 66% of voters told us, “No!”
Independent voters want more choices in their candidates who have a real chance of winning. They directly told us so when we asked “Would you like to see a viable third-party candidate run for President in 2024?”
The two-party system is not serving their needs and Americans want something new.
However, the want for more choices doesn’t stop with candidates.
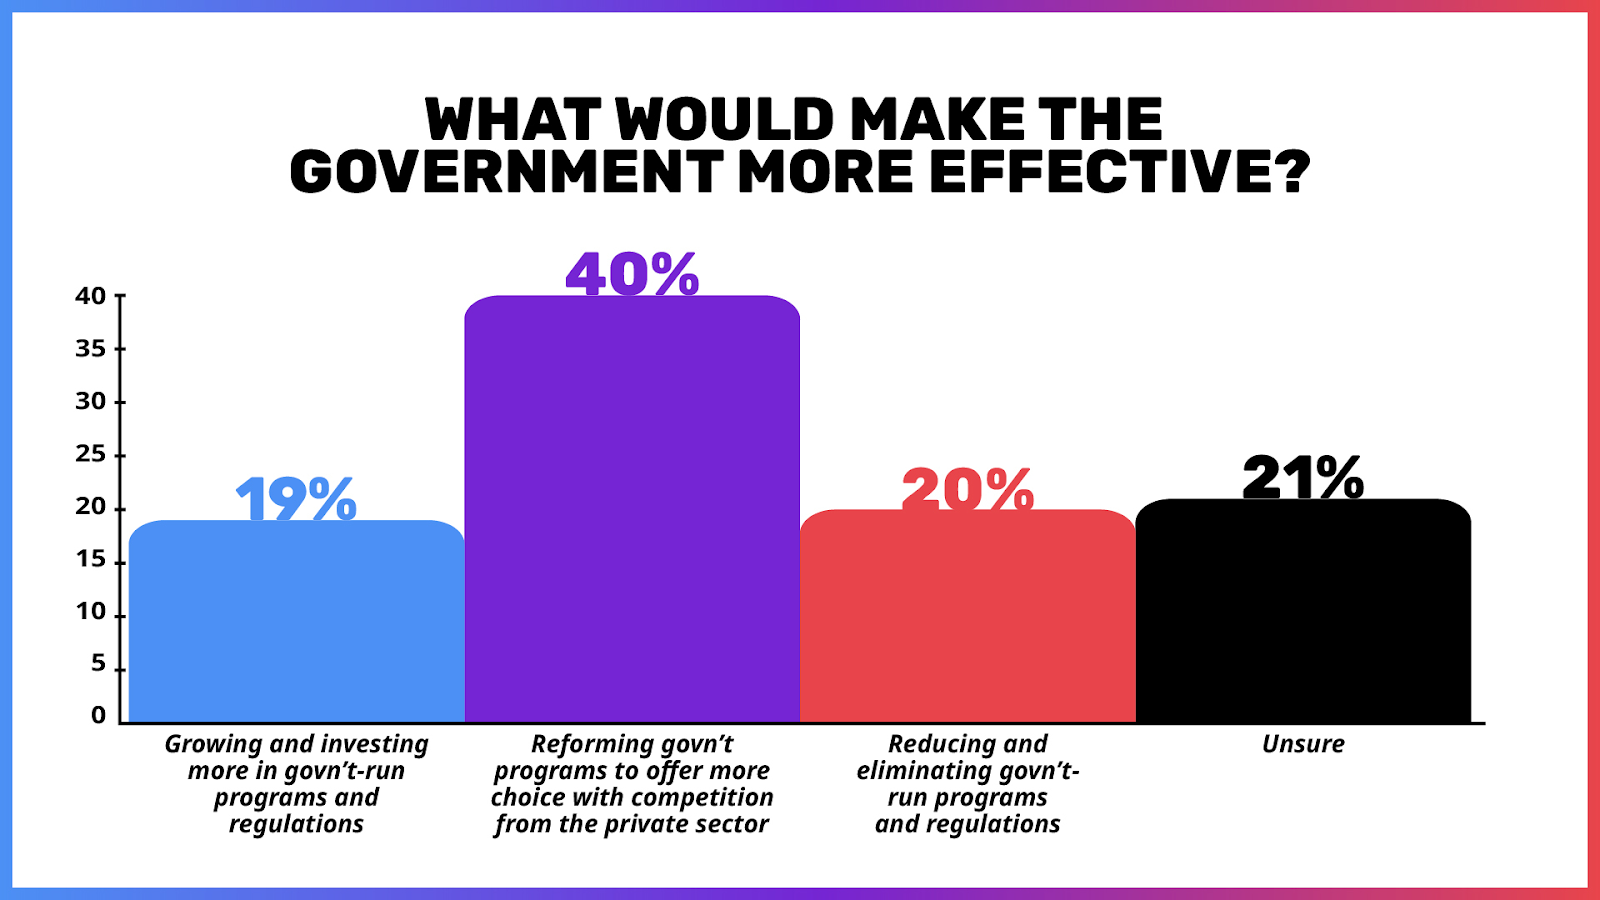
Choice is an important aspect of how independent voters evaluate public policy. We asked, “Which of the following do you believe would make the government more effective?” Given the choices, voters told us they wanted to see reforms that mix private and public solutions.
It’s not that independent voters are all pushing for total unregulated capitalism in everything, it’s that they don’t want to be stuck with a single monopolistic solution, rather it’s a governmental or private market monopoly.
We can see this play out in how independents evaluate health care and education policy. In both cases, they want a mixed solution that gives citizens a choice between government and private services.
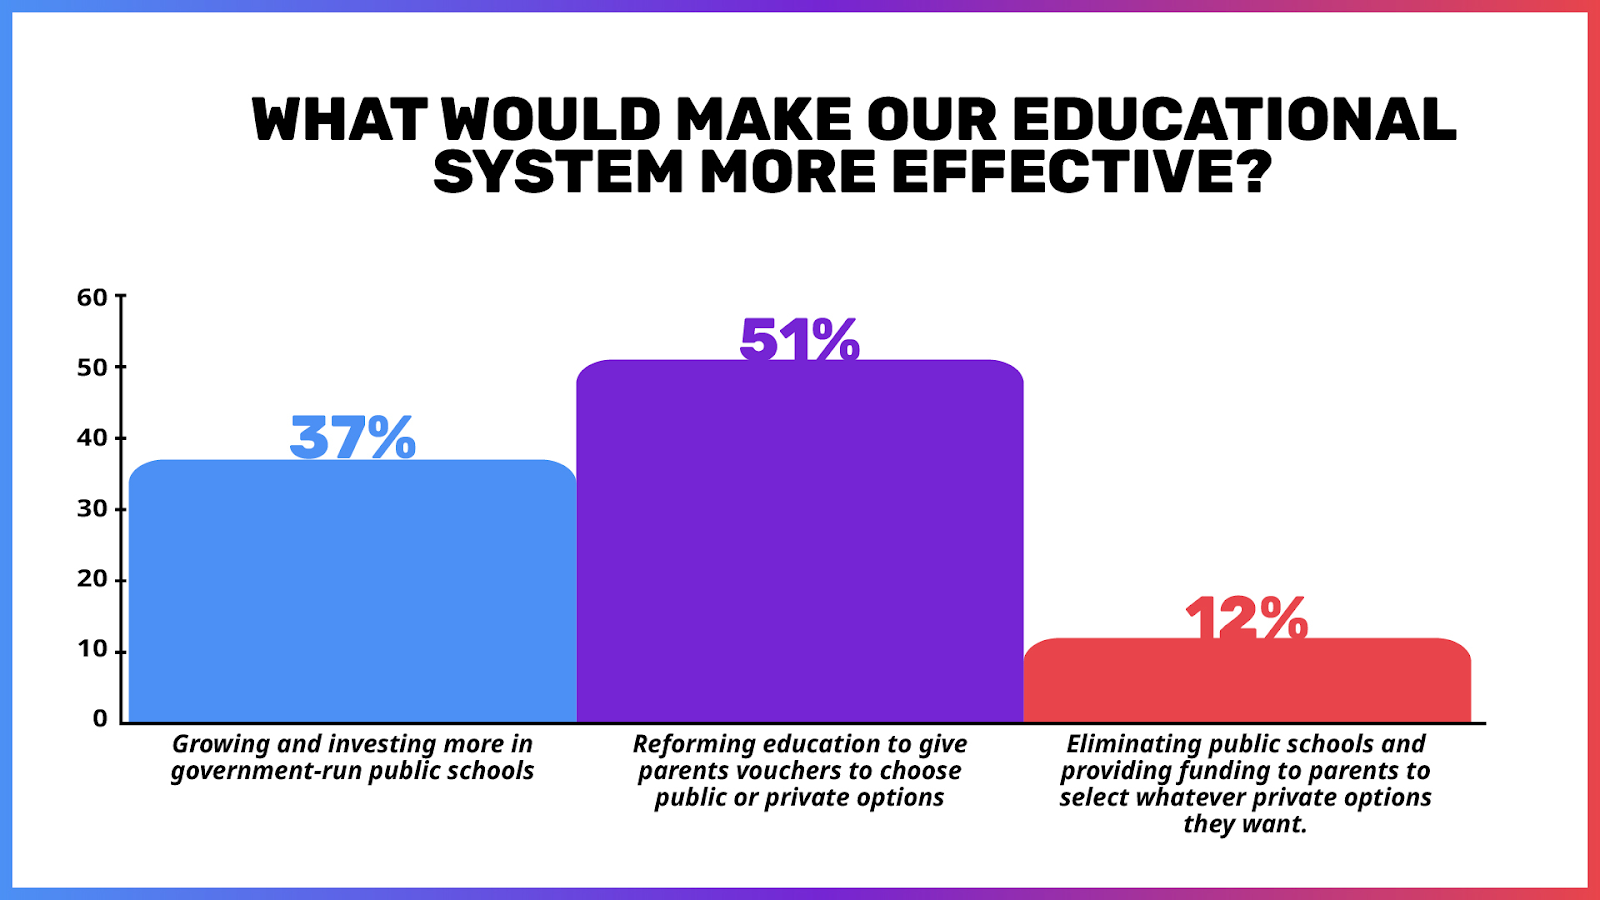
For education, we asked, “Which of the following do you believe would make our educational system more effective?”
For healthcare, we presented the statement, “Medical coverage is a necessity for everyone eventually,” and then asked them to pick which of the following three responses best aligned with their view on the subject.
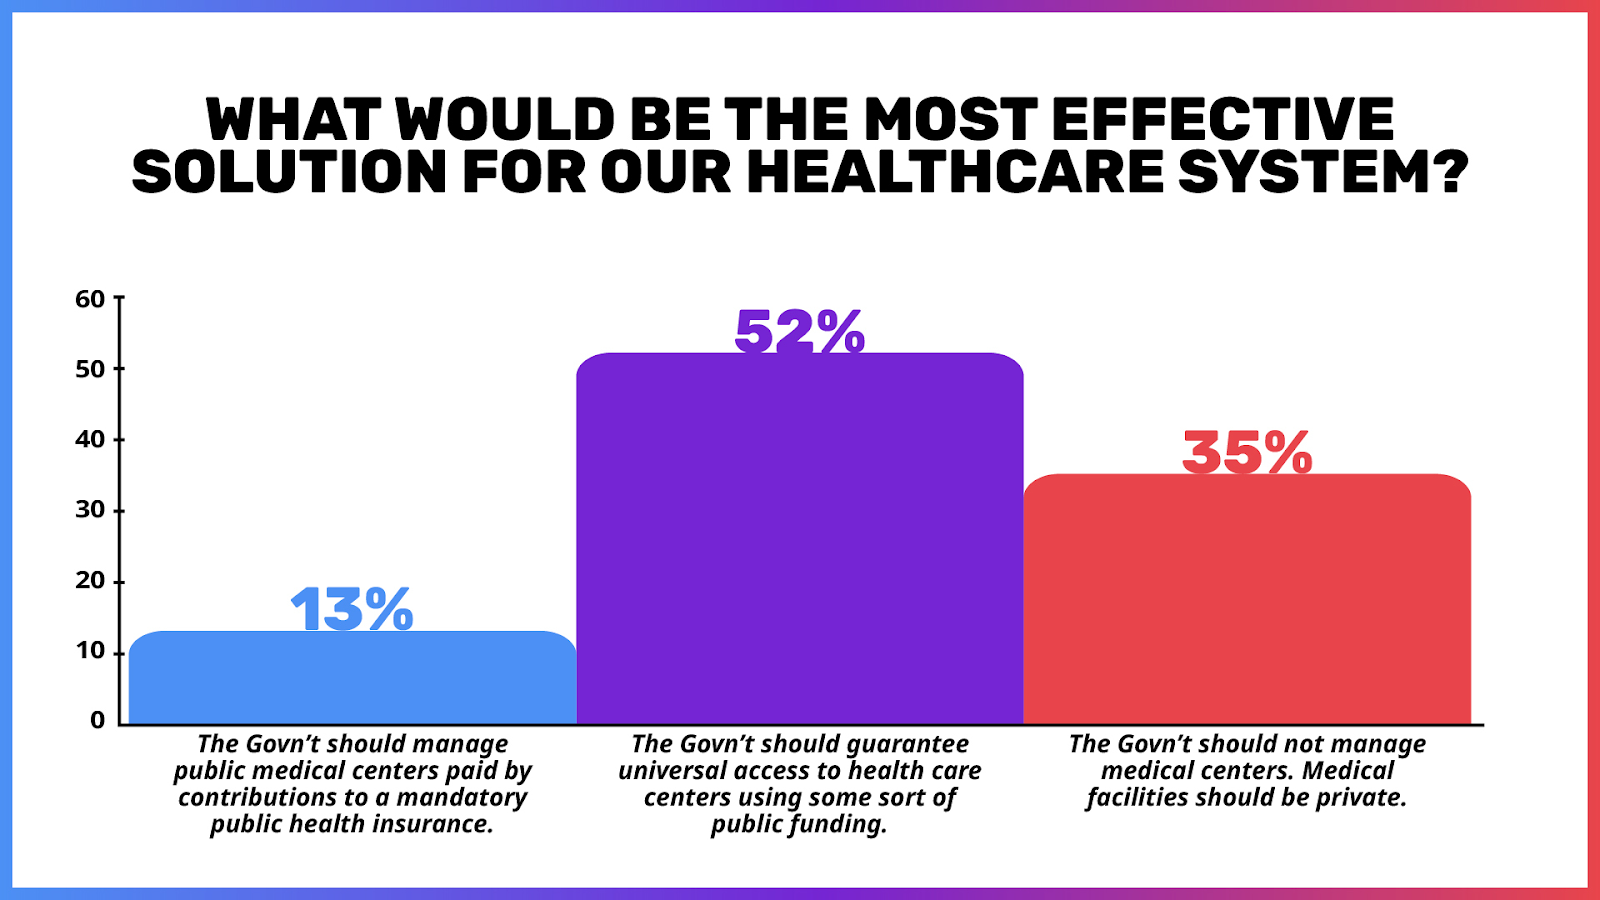
On both of these policy subjects, voters want to have the choice between private and public solutions. They want the government to have a hand, especially in funding, but don’t want to see regulations pushing out the market-based options.
The message from independent voters is crystal clear: they are fed up with the status quo and hungry for more options. Their dissatisfaction with the two-party system and the current policy-making process is a loud call for a political overhaul. It’s time for DC to listen and introduce a political landscape that mirrors the complexity and diversity of the populace it aims to serve.